Analyzing a USDCAD Short Setup at a Weekly Reversal Zone
The Anatomy of a High-Probability Trade Idea
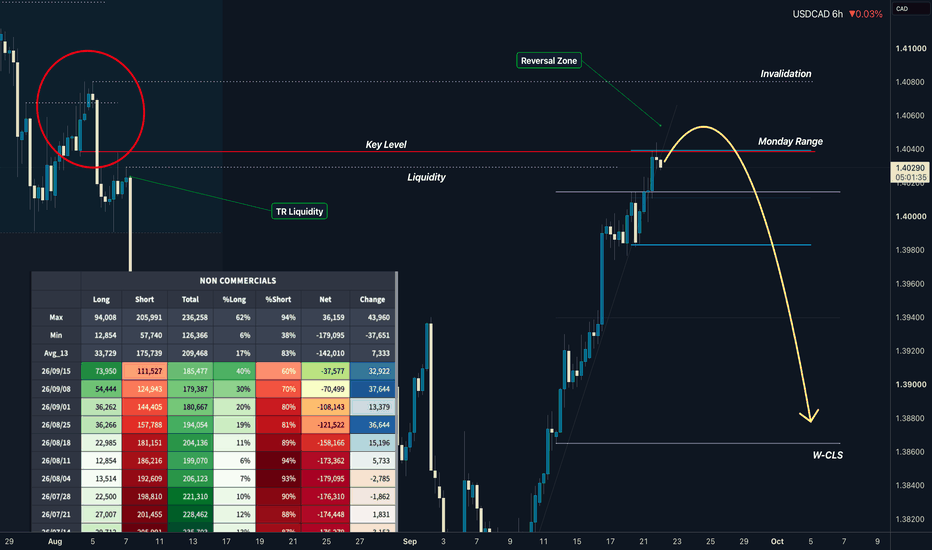
Professional trading isn't about guesswork; it's about building a case. Each trade idea should be supported by multiple, converging pieces of evidence. A recent TradingView idea on USDCAD by David Perk provides a perfect example of this methodical approach. The chart showed the pair approaching a significant area of interest, setting the stage for a potential short trade based on the CLS strategy.
Let's break down the layers of analysis that made this setup compelling.
Identifying the Higher Timeframe Context
The foundation of this trade idea was the higher timeframe chart, specifically the weekly perspective. The chart highlighted a "Weekly Short Zone," a critical area where sellers had previously taken control of the market. When price returns to such a level, it's like a sports team returning to a field where they have a historical advantage. It doesn't guarantee a win, but it puts the odds in their favor.
This weekly zone acted as the primary reason to even consider a bearish position. Without this overarching context, any short trade would be significantly weaker.
The CLS Range and Market Manipulation
At the core of the analysis was the identification of a new "CLS Range." In the CLS strategy, a range often represents a period of balance or consolidation. The theory suggests that after a period of manipulation, price will often seek to return to the equilibrium of this range.
In this USDCAD setup, the price had pushed above the established range and into the weekly short zone. This is a classic pattern of manipulation. Institutional players may drive prices beyond obvious levels to trigger stop-loss orders from retail traders who were already short. Once this liquidity is captured, the market is often primed to move in the intended direction—in this case, down.
The idea was not to short blindly at the zone, but to wait for the manipulation to complete and for the market to show its hand.
Confluence from the COT Report
To strengthen the bearish bias, the analysis incorporated data from the Commitment of Traders (COT) report. The idea noted that institutional positioning for the Canadian Dollar (CAD) was shifting. Shorts were being closed, and longs (CAD buys) were being built up.
Because the Canadian Dollar is the second currency in the USDCAD pair, a stronger CAD leads to a weaker USDCAD. This COT data provided a powerful tailwind for the bearish thesis, suggesting that large market participants were positioning for the same directional move. This is a key part of building a robust trading plan, a skill often honed with a forex mentor.
By combining the weekly resistance, the CLS range dynamics, the manipulation pattern, and the COT report, the setup was no longer just a line on a chart. It was a well-reasoned, high-probability scenario waiting for a specific trigger to signal entry.
WRITTEN BY
David Perk
Full-time forex trader and mentor. $1M+ verified track record on FX Blue. Teaches the CLS strategy to funded traders — live, five times a week.
Want to trade this alongside David?
Join the community — livestreams 5× a week, trade breakdowns, and entries called in real time. Your first week is free, full access to every paid feature.
Join the community — first week freeNo experience needed. Cancel anytime.