Reading the AUDUSD Chart with the CLS Strategy
From a Blank Chart to a Clear Plan
Staring at a price chart can be overwhelming. To the untrained eye, it's a chaotic series of random up and down movements. But for a trader equipped with a structured methodology, it's a story waiting to be read. The CLS strategy provides a logical framework to interpret that story, identify high-probability scenarios, and execute with clarity.
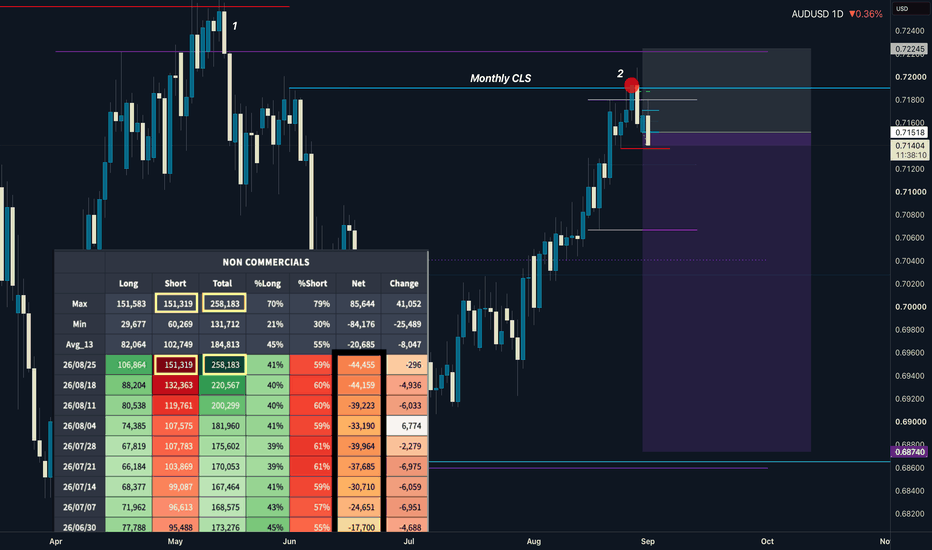
Let's use a recent analysis of the AUDUSD daily chart to illustrate how this strategy deciphers market structure and anticipates future price movement. This is a practical example of the concepts we teach every day in our forex academy.
Starting with the Macro View
Before diving into the smaller details, a professional trader always establishes a directional bias. The title of the trade idea itself provides a powerful clue: "COT 5 Years Biggest Shorts." This refers to the Commitment of Traders report, which showed that large institutional speculators were holding their largest net short position on the Australian dollar in five years.
This macro context is invaluable. It tells us that the "big money" is positioned for a decline in AUDUSD. With this bearish tailwind, we can then look for short setups on the daily chart with greater confidence. A comprehensive trading course will always teach you to align your trades with the dominant market sentiment.
Deconstructing the Bearish CLS Model 1
The trade idea outlines a specific sequence of events based on the CLS Model 1 for short positions. This isn't about guesswork; it's a repeatable pattern of market behavior.
Step 1: The CLS Range
The first step is identifying the "CLS Range." This is the current, clearly defined consolidation or trading range that the market is operating within. This range provides the boundaries for our analysis and helps us define key areas of interest.
Step 2: Manipulation into a Key Level
One of the core concepts of the CLS strategy is that markets are engineered to manipulate participants. The idea looks for price to push below the established CLS range and into a key level. This move is designed to trick traders into thinking a breakout is occurring and to trigger the stop losses of existing long positions. This manufactured liquidity grab is often the precursor to the market's true intended move.
Step 3: Confirmation via a CIOD
After the manipulation, we don't just jump into a trade. We need confirmation that the manipulation is over and the real move is about to begin. This confirmation comes in the form of a "CIOD"—a Change in Order Flow. This is a specific price action pattern that signals a shift from the bearish pressure of the manipulation phase to renewed bullish momentum (in a long setup) or, in this case, a return to bearish pressure for the expansion downward. As any good forex mentor will tell you, waiting for confirmation is what separates professional execution from amateur chasing.
Step 4: The Expansion Phase and Target
Once the CIOD is confirmed with a candle close, the expansion phase is expected to begin. This is the directional move we've been waiting for. The plan has a clear, logical objective: a target at the "50% of the CLS range." This provides a predefined take-profit level, ensuring the trade has a logical conclusion.
If you want to learn forex trading, adopting a structured, repeatable methodology like the CLS strategy is non-negotiable. It transforms a chaotic chart into a clear, actionable plan, allowing you to trade with the confidence and precision of a professional.
WRITTEN BY
David Perk
Full-time forex trader and mentor. $1M+ verified track record on FX Blue. Teaches the CLS strategy to funded traders — live, five times a week.
Want to trade this alongside David?
Join the community — livestreams 5× a week, trade breakdowns, and entries called in real time. Your first week is free, full access to every paid feature.
Join the community — first week freeNo experience needed. Cancel anytime.