GBPUSD Analysis: A CLS Model 1 Long Setup
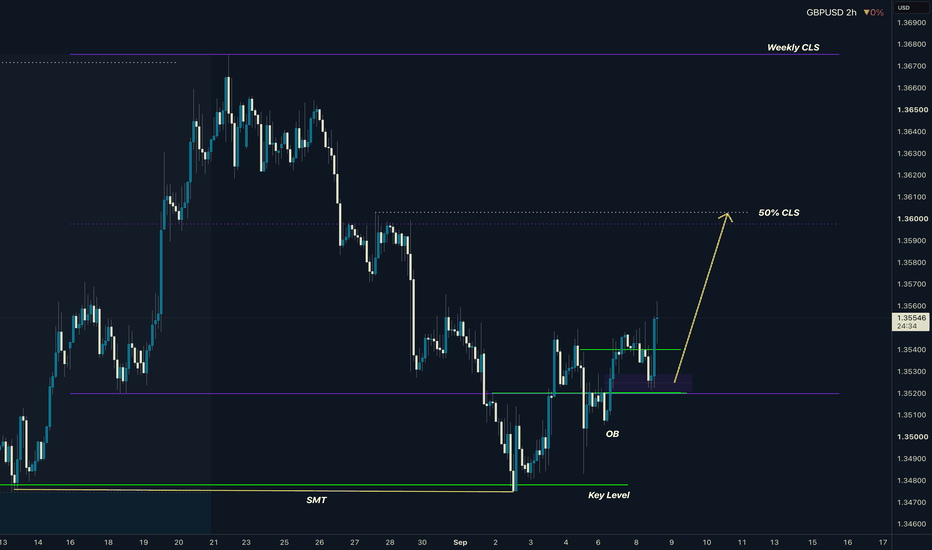
A High-Probability GBPUSD Setup in Focus
In the world of forex trading, clarity is king. A well-defined strategy removes guesswork and provides a clear framework for decision-making. In a recent TradingView idea, I highlighted a potential long opportunity on GBPUSD based on my proprietary CLS Strategy. This wasn't just a random prediction, but a structured analysis of a specific pattern: the CLS Model 1.
Let's break down what the chart was showing and why this setup presented a compelling, logical case for a potential bullish move. For those looking to deepen their forex education, understanding this structure is a valuable exercise.
Deconstructing the CLS Range
The foundation of this entire setup is the creation of a new "CLS Range" on the 2-hour timeframe. What is a CLS Range? It's a period of consolidation where price moves sideways, creating a clear upper boundary (high) and lower boundary (low). This range represents a temporary balance between buyers and sellers, a pause before the market's next significant move.
In this GBPUSD chart, the formation of this range was the first critical piece of the puzzle. It provided the context for everything that followed. Think of it as setting the stage for the main event.
The Anatomy of a CLS Model 1 Trade
Once the range is established, the CLS Model 1 follows a specific sequence of events. This is not about predicting the future but about reacting to predictable market behavior around key liquidity zones.
Phase 1: The Manipulation
The first anticipated event is a "manipulation" phase. This is where price breaks below the established low of the CLS range. To an untrained eye, this might look like a bearish breakout and a reason to sell. However, within the CLS strategy, this move is often interpreted as a hunt for liquidity—a deliberate push by institutional players to trigger stop-loss orders resting below the range.
I was specifically watching for price to dip into a Key Level below this range. The reaction at this level is crucial. A sharp rejection or failure to continue lower is the first sign that the move was indeed a manipulation, not a true breakout.
Phase 2: The Confirmation (CIOD)
This is the most important part of the setup and where patience becomes a trader's greatest asset. After the manipulation and reaction, we must see a "Confirmation Switch." I call this a CIOD, or a Change in Order Flow.
This is a clear signal on the chart that the bearish pressure from the manipulation phase has subsided and buyers are stepping back in with force. It's the market showing its hand, confirming that the move below the low was a fakeout. As a trading coach, I always emphasize waiting for a definitive candle close that confirms this shift before even considering an entry.
Phase 3: The Expansion
Only after the CIOD do we anticipate the "expansion" phase. This is the strong directional move that we aim to capture. Based on the CLS Model 1 rules, the logical target for this expansion is the 50% level of the initial CLS range. This provides a clear, pre-defined take-profit objective, removing emotion from the exit process.
By waiting for this specific sequence—Range, Manipulation, Confirmation—we can engage with the market on our terms. This structured approach, which I teach in my trading academy, transforms trading from a gamble into a disciplined, repeatable process.
WRITTEN BY
David Perk
Full-time forex trader and mentor. $1M+ verified track record on FX Blue. Teaches the CLS strategy to funded traders — live, five times a week.
Want to trade this alongside David?
Join the community — livestreams 5× a week, trade breakdowns, and entries called in real time. Your first week is free, full access to every paid feature.
Join the community — first week freeNo experience needed. Cancel anytime.