DXY Analysis: A CLS Range Reversal Setup Explained
Decoding a High-Probability DXY Reversal Setup
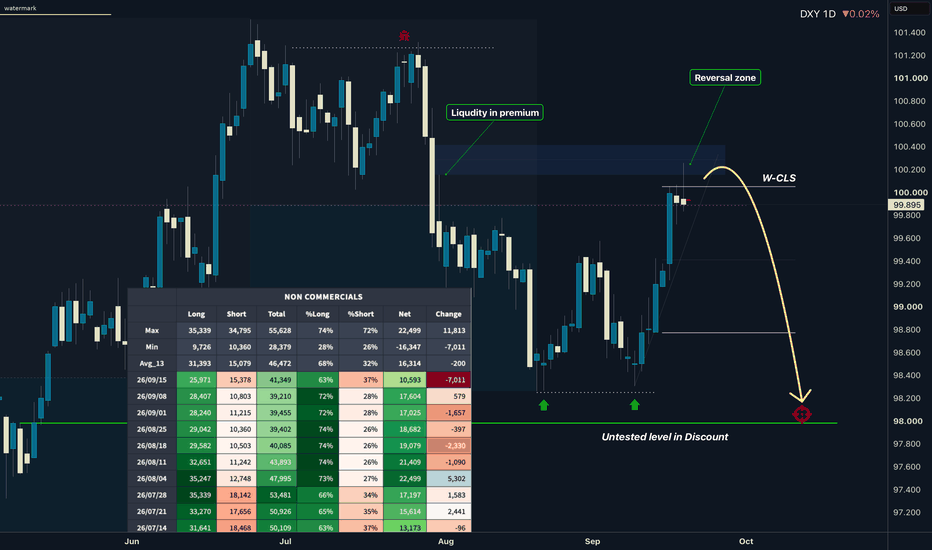
In the world of forex trading, understanding market structure is paramount. A recent analysis by our head trader, David Perk, on the US Dollar Index (DXY) provides a masterclass in identifying potential reversals using a specific, repeatable framework. This isn't about predicting the future; it's about preparing for a high-probability scenario based on a clear structure. Let's break down the components of this daily chart setup.
The foundation of this trade idea, as highlighted in the original TradingView post, is the creation of a new CLS Range. This range acts as our map, defining the key boundaries of recent price action and setting the stage for the next potential move.
The Anatomy of a CLS "Long Model 1" Trade
The CLS strategy is not just a set of indicators; it's a logic-based approach to reading price action. For this DXY setup, David is anticipating a "Long Model 1" trade. This model follows a distinct sequence of events that professional traders learn to recognize.
1. The Manipulation Phase
First, we anticipate a manipulation. The analysis points to a potential move into a Key Level located below the established CLS range. This is a critical phase where the market often engineers liquidity by pushing prices below an obvious support level, triggering stop losses from breakout sellers and early buyers. A patient trader, guided by proper forex education, understands that this is not a signal to sell, but a point of interest for a potential reversal.
2. The Reaction
Following the dip into the key level, the next piece of the puzzle is the market's reaction. We need to see price reject these lower levels. This can manifest as a sharp bounce, a long-wicked candle, or a failure to continue pushing lower. This reaction suggests that the manipulation may be complete and that stronger hands are beginning to accumulate positions.
3. The Confirmation (CIOD)
This is arguably the most important step and where discipline is essential. A reaction alone is not enough to enter a trade. We must wait for a CIOD (Change in Order Flow). This is a clear signal on the chart that the order flow has shifted from bearish (selling pressure) to bullish (buying pressure). It confirms that the manipulation phase is over and a new expansionary move to the upside is likely beginning. As David notes, waiting for a candle close to confirm the CIOD is a rule that helps filter out false signals.
Defining Logical Targets
Once a trade is confirmed and entered, knowing where to take profit is just as important as knowing when to get in. The analysis outlines three logical targets for this potential long trade:
- Target 1: The 50% level of the CLS range. This is often the first area of potential resistance where a partial profit can be secured.
- Target 2: The top of the full CLS range. This represents a complete reversion to the mean.
- Target 3: An untested level in the discount zone, which would offer an even greater reward.
This DXY setup is a powerful example of the structured approach taught within our trading academy. It combines an understanding of market mechanics (manipulation) with a patient, confirmation-based entry model. By learning to identify these key elements, traders can move beyond guesswork and begin executing trades based on a sound, logical framework.
WRITTEN BY
David Perk
Full-time forex trader and mentor. $1M+ verified track record on FX Blue. Teaches the CLS strategy to funded traders — live, five times a week.
Want to trade this alongside David?
Join the community — livestreams 5× a week, trade breakdowns, and entries called in real time. Your first week is free, full access to every paid feature.
Join the community — first week freeNo experience needed. Cancel anytime.