CLS Strategy in Action: Deconstructing the BTCUSD Trade
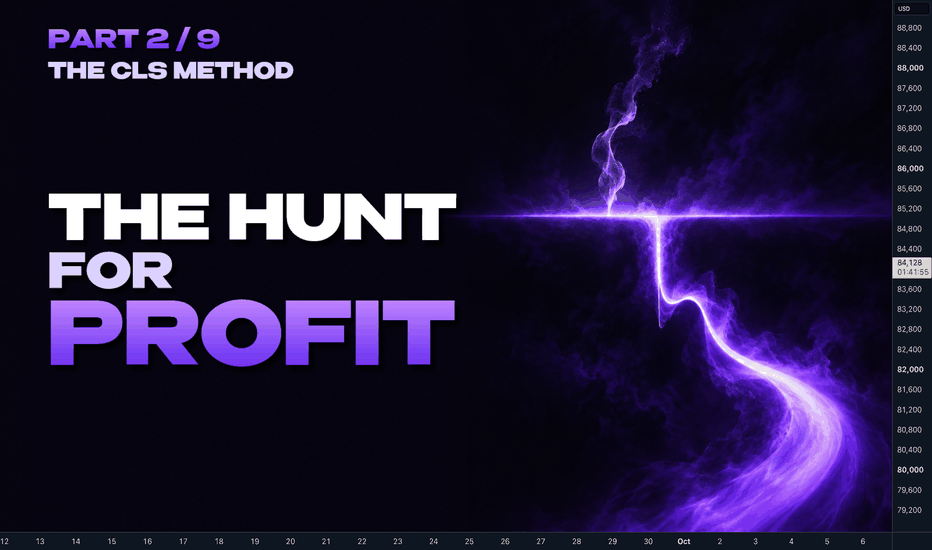
Beyond Indicators: A Logic-Based Approach
Many trading strategies rely on a complex mix of lagging indicators, creating signals that are often late and disconnected from the market's true intent. The CLS strategy (Construction-Liquidity-Manipulation-Signal) is different. It’s a methodology rooted in the foundational 'why' of price movement: the hunt for liquidity.
To make this tangible, let's deconstruct a recent BTCUSD trade, step-by-step, through the lens of the CLS framework. This isn't about hype; it's about providing a clear, educational breakdown of a professional trading process.
The Core Principle: Price Moves to Liquidity
Before analyzing the chart, you must accept the core premise of the CLS strategy: price is not random. It is intelligently drawn towards pools of orders (liquidity). These pools exist above old highs (buy stops) and below old lows (sell stops). Large institutions need this liquidity to fill their massive orders. Our job is to spot them doing it.
Phase 1: Construction
The first step in the CLS framework is identifying the 'Construction.' This is the part of the chart where liquidity is visibly building.
On the BTCUSD chart, this was a clear, horizontal support level. Every time price touched this level and bounced, more traders took notice. They placed long orders at the level, with their sell-stops just underneath it. Others prepared to sell a breakout if the level failed. This predictable retail behavior constructs the pool of sell-side liquidity that institutions will later target.
Phase 2: Liquidity & Manipulation
With the construction identified, we now anticipate the 'Manipulation'—the move to grab the liquidity. This is the event that gives the CLS strategy its edge, based on our core rule: "No manipulation, no trade."
This phase was the aggressive, sharp drop below the support level on BTCUSD. This move achieved two things for institutional players:
- It triggered the sell-stops of traders who were already long.
- It induced breakout sellers to enter the market, adding more selling pressure.
This flood of retail selling provided the perfect opportunity for institutions to absorb all those sell orders to fill their own large buy orders at a favorable price. This is the liquidity grab in action.
Phase 3: The Signal
A crucial distinction of the CLS strategy is that we do not trade during the manipulation phase. We are not trying to catch the falling knife. We are waiting for the 'Signal,' which is the confirmation that the manipulation is complete and the institutions have shown their hand.
The signal on the BTCUSD chart was the price's rapid reversal and reclaim of the support level it had just broken. This sharp 'V-bottom' reversal is the footprint. It tells us the downward move was fake, the institutional buyers are in control, and the path of least resistance is now likely to the upside.
This confirmation—the failure of the breakdown—is our trigger to enter long, with a defined stop just below the manipulation low. This methodical process, taught in-depth at our forex academy, transforms a seemingly chaotic chart into a clear, actionable story. It's the difference between gambling on patterns and trading based on logic.
Learn this with live trading signals
This is the same process David uses when he publishes trading signals inside the CLS Lab membership. Join the trading community, follow the live signals, and sit in the streams — your first 5 days are free.
WRITTEN BY
David Perk
Full-time forex trader and mentor. $1M+ verified track record on FX Blue. Publishes CLS trading signals and teaches the process live inside the membership.
Learn more in the membership — trading signals included
Join the trading community for live CLS signals, daily streams, and the same setups you just read. First 5 days free, full access.
Start 5 days free — signals + membershipNo experience needed. Cancel anytime.